
In recent weeks I’ve been placing increasing attention on more globally focussed companies (within the scope of my investable countries). My methodology and stock screener is simple: Focus on companies with positive and growing free cash flow, little to no debt, good and consistent return on invested capital, and growing net income. Lastly, I screen for companies which have compounded returns for shareholders at 10% or more in the past five years. As a basic screen, this omits companies which are loss making, heavily indebted, or otherwise in financial decline. They must also trade at a reasonable valuation (my basic proxy for this being <35 P/E).
This week (28/09/24) I’m taking a brief look at three of those companies added to my watchlist. Do any of them warrant a more comprehensive investigation in the next few weeks?
Odessos Shiprepair Yard S.A. (BUL-ODES)
| Market Cap: BGN 183.03M (£78.1m) | P/E: 11.05 | Levered FCF 5Y CAGR: 5.89% |
| Net Margin: 16.45% | ROIC 5Y Avg: 16.86% | Diluted EPS 5Y CAGR: 60.55% |
| Net Income 5Y CAGR: 60.55% | Debt / Equity: 0.15 | Dividend Yield: 5.13% |
The Company
Odessos Shiprepair Yard S.A. are a Bulgarian ship repair (surprise surprise) and maintenance company based in the Black Sea, and listed on the Bulgarian Stock Exchange. The company was founded in 1955 and has repaired over 5,000 vessels since its founding, through the use of its two floating and one graving (dry) dock infrastructure. The shipyard is one of four across Bulgaria, however their largest dock has a capacity far and away larger than anything else the other three can offer, at 90,000 deadweight tonnes.
The company have grown revenues in each of the past ten years, with a slightly more mixed bag with regard to net income. This has however grown strongly in the past few years. Odessos have generated positive free cash flow in each of the past ten years, and all liabilities are covered by cash and cash equivalents.
The company is priced at 1.9 times sales and has an earnings yield of 9.1%. On to the valuation!
Valuation
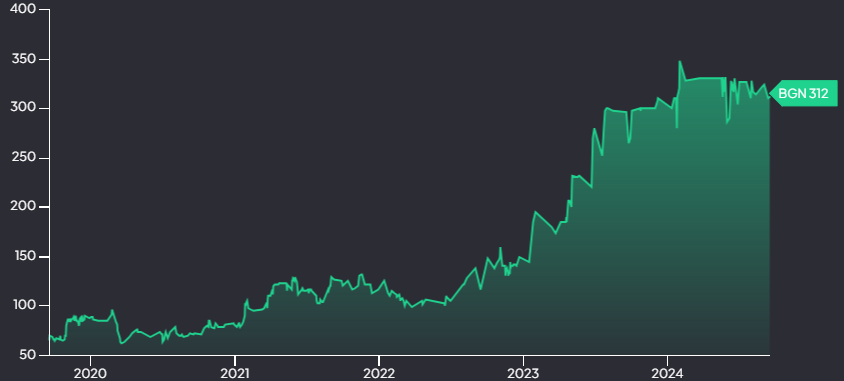
Current price: BGN 312 per share.
Odessos Shiprepair Yard S.A. are consistently cash flow generative. Net income growth has been impressive in the past few years, but growth generally has been solid. Since listing in 2008, Odessos has compounded returns at a rather lethargic 4.3%, however the past five years’ compound return rockets up to 42.9%. If I factor in an assumed risk-free rate of 11% (3.9% is currently available on 10 year Gilts plus ~7% equity risk premium) and an assumption that returns can grow at the same 42.9% pace for the next five years, dropping to 3% in perpetuity after that, I arrive at an intrinsic per-share value of BGN 979. This equates to a 21.96% annual return.
A CAGR of 42.9% is high, and I question how sustainable this might be. If I halve this rate, the intrinsic value drops to BGN 402, an annual rate of return of 12.95%. In my view, the company is on the low end of most valuation metrics, and certainly undersells the impressive growth in per-share earnings that they have been able to achieve. With that 5%+ dividend yield as well, this appears to me to be an appealing prospect.
Orzel Bialy S.A. (WSE-OBL)
| Market Cap: PLN 562.79M (£109.84m) | P/E: 6.05 | Levered FCF 5Y CAGR: 28.31% |
| Net Margin: 13.56% | ROIC 5Y Avg: 17.74% | Diluted EPS 5Y CAGR: 63.4% |
| Net Income 5Y CAGR: 63.23% | Debt / Equity: 0.92 | Dividend Yield: 2.96% |
The Company
Orzel Bialy S.A. are engaged in the recycling of waste batteries and lead-bearing waste. They take this material and create lead and lead alloy products for sale primarily to the automotive industry for the creation of batteries. Orzel Bialy has been listed on the Warsaw Stock Exchange since 2007, and have a 30 year pedigree in the recycling market. The origins of the business, however, date back to 1858, situated in one of the most fertile mining basins in Poland. I also appreciate that they dedicate a website page to their growth strategy, with point one being “improving the bottom line”. As you’ll see below, they appear to have demonstrated an ability to achieve this.
How has the company performed, financially? Whilst the trend to growth has largely been positive, revenues dipped in the tail end of the 2010’s. Growth resumed strongly following this, but has dipped again recently. Per-share earnings however have grown since 2018, and once again cash and cash equivalents easily cover all debt. Free cash flow has been positive in all but three of the past ten years, and typical CapEx demands are very low. Net income last year, for example, was 106.5m, with CapEx at 4.2m. Low ongoing CapEx requirements are a bonus.
Valuation
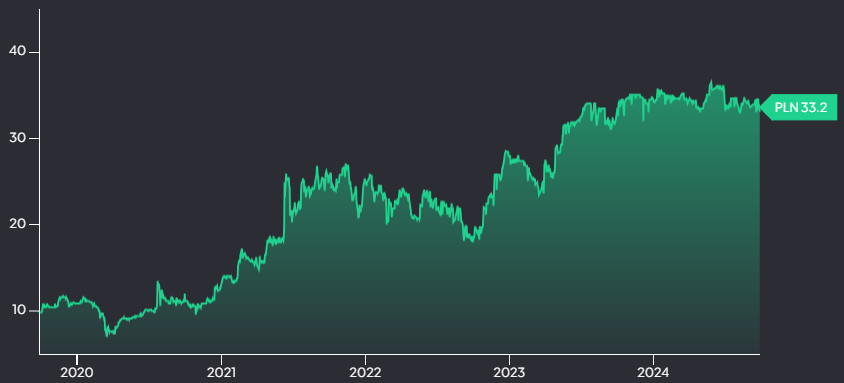
Current price: PLN 33.2 per share.
Orzel Bialy have grown revenues in the mid-single digits since listing in 2007, and total return has averaged around 4% a year. As mentioned, however, per-share earnings have been in the mid to high teens and the five year total return CAGR sits at 28.3%. The company sits on an attractive valuation of a little over six times earnings, a price to book of less than 1, and an enterprise value/sales ratio of 0.44. Returns on invested capital are solid, as are their gross and operating margins. And there is that solid 3% dividend yield to boot.
Net income has grown at over 50% annually in the past five years, again a figure that makes me uneasy when using in a discounted cash flow calculation. If I halve this, assume this growth can continue for five years, with 3% growth in perpetuity thereafter, I arrive at an intrinsic per share value of PLN 79.06, or a 19.35% annual return. Even with net income growth in the high single digits, this should represent an acceptable annual return. I think there is an adequate margin of safety here.
Cambuci S.A. (BOVESPA-CAMB3)
| Market Cap: R$515.01M (£70.88m) | P/E: 6.79 | Levered FCF 5Y CAGR: 45.67% |
| Net Margin: 16.84% | ROIC 5Y Avg: 20.48% | Diluted EPS 5Y CAGR: 17.05% |
| Net Income 5Y CAGR: 33.93% | Debt / Equity: 0.01 | Dividend Yield: 2.64% |
The Company
Lastly, Cambuci S.A. are a Brazilian sports equipment manufacturer, with a focus on the football (soccer) industry where they are the leading manufacturer across the country. Through a potential quirk of Google Translate, they describe themselves as “the absolute leader in balls”. This is another company with a storied history, dating back to 1945. The company operates two main brands, Penalty (launched in 1970) and Stadium Sports (launched in 2005).
Cambuci are accredited as a company of quality, holding international certification within institutions across football (FIFA), volleyball (FIVB), basketball (FIBA) and Handball (IHF). This international accreditation has facilitated expansion beyond Brazil, further into South America, as well as Africa, Europe and Asia, however by far the most significant revenues come from their domestic market currently.
Reading their Q2 report I was particularly impressed with the below statement:
“In a scenario that predicts that monetary authorities will maintain high interest rates for a longer period of time, the management’s decision to eliminate net debt, preserve margins, keep inventory levels low and invest in innovation, without deteriorating its payment capacity, proved to be the right one and further strengthened the Company’s financial fundamentals.”
Source: Cambuci S.A. Q2 Report
One only needs to look at historical balance sheet reporting to see that the company dramatically reduced long term debt, and now has a very healthy balance sheet in which current assets easily cover all liabilities. Cambuci currently sits on an earnings yield of 14.8%, a free cash flow yield of over 20%, and a price to sales ratio of 1.1. This company is cheap. But is it cheap and good?
Net income has grown in each of the past five years, with positive free cash flow generation in eight of the past ten years. Gross and operating margins are higher than they’ve been in the past decade, with the trend generally continuing upward. There is a solid and consistent return on capital, indicating an ability to generate positive and growing revenues on capital employed by management. Per share earnings growth is far and away higher than the current valuation would suggest.
Valuation
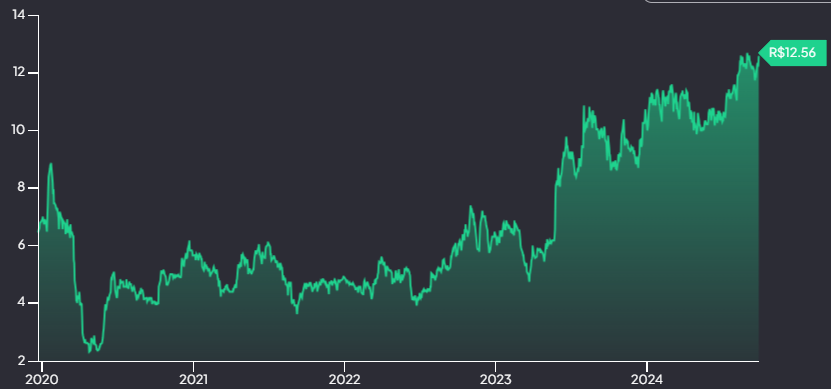
Current price: R$12.56 per share.
Free cash flow generation has been somewhat skewed by the most recent year’s report (R$127.4m) so instead I’ll use a five year average FCF generation figure of R$27.52m. Arriving at an appropriate discount rate is a little trickier. The current ten-year yield on government debt is 12.3%, which is of course considerably higher than in more developed western countries. I like to use the figures presented by market-risk-premia.com to understand fluctuations in the risk free rate and risk premia. For Brazil, currently, the implied market return (which will be our discount rate) is 13.1%.
Net income has compounded at a little over 37% for Cambuci over the past five years. Were one to assume this could continue for another five (dropping to 3% thereafter as usual), the intrinsic value would be R$28.20 per share, or a 21.67% annual return. Drop that to a 20% CAGR and the intrinsic value drops to R$13.78.
Investing in this market has a higher implied risk, which drags down the implied valuation upside. As to the merit in using a discounted cash flow analysis in this instance, I’m not so sure. If one were to judge purely based on valuation, and quality of business, I’d argue there’s a mispricing here and that the company looks undervalued.
Conclusion
The three companies discussed above are presented without recommendation or advice. This is my interpretation of the merits of each, and my opinion on the potential for them to grow and generate an acceptable return in a portfolio. That being said, I’d love to know your thoughts so please comment below, or find me on X at x.com/BritishInvestor or Bluesky @britishinvestor.bsky.social.
If you enjoyed this post, please also consider sharing it on the platforms above.
Happy investing!
Chriss
P.S. I’m a recent convert to Finchat.io, an A.I. assisted financial screening and share database that has drastically simplified my search and analysis process. Take a look via my referral link here.