Running my stock screener this week has returned a whopping nine UK equities, and 351 globally. My methodology is simple: Focus on companies with positive and growing free cash flow, little to no debt, good return on equity and capital, and growing net income. As a basic screen, this omits companies which are loss making, heavily indebted, or otherwise in financial decline. They must also trade at a reasonable valuation (my basic proxy for this being <35 P/E).
This week I’m taking a brief look at three of those companies added to my watchlist. Do any of them warrant a more comprehensive investigation in the next few weeks?
Alpha Group International PLC (LSE:ALPH)

| Market Cap: £1,095.73M | P/E: 12.68 | Revenue 5Y CAGR: 51.27% |
| Net Margin: 47.77% | ROCE 5Yr Avg: 30.89% | ROE 5Yr Avg: 25.66% |
| Net Income 5Y CAGR: 62.58% | Debt / Equity: 0.1 | Dividend Yield: 0.62% |
The Company
Alpha Group International PLC is a financial services company, operating two distinct business segments. The first, and largest, is their Foreign Exchange (FX) Risk Management service, accounting for approximately 69% of revenues. The remainder comes from their secondary business, providing Alternative Banking Solutions to investment managers and fund administrators.
Their FX Risk Management business is as it sounds. They work with over a thousand corporate and institutional clients to establish appropriate, bespoke risk management profiles, services and technologies, helping to minimise currency risk in foreign exchange transactions. Reading their latest annual report, and their business introduction documents, one can’t but help admire the candid nature of the explanations of their service. An excerpt below illustrates this, I feel:
“Our approach to managing currency volatility is risk
“An Introduction to FX Risk Management”
management led, not FX market led. We know that
nobody can reliably predict the currency market,
and to pretend otherwise would compromise our
clients’ commercial objectives. Our belief is that any
conversations around currency markets and “when”
to buy should only take place after a clearly defined
risk management strategy is in place. It is for this
reason, that we don’t consider ourselves, nor position
ourselves, as FX market experts”
Their Alternative Banking service focusses on supporting investment funds and services to manage resources across multiple global jurisdictions. For these corporate entities, managing multiple accounts (into the thousands) creates a significant operational overhead, and is both time consuming and open to error. Alpha Group help address this by providing two key services, bespoke support, and a unified platform for managing multi-jurisdiction accounts.
Valuation
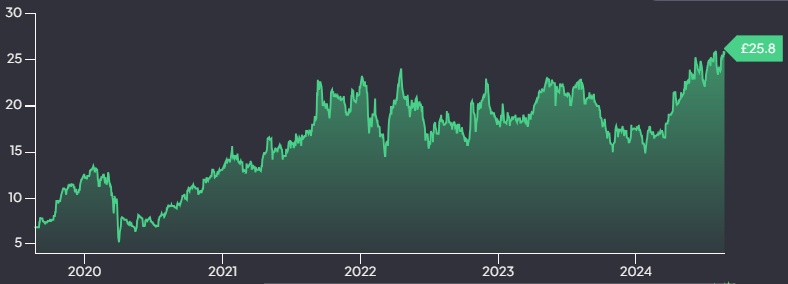
Current price: £25.80 per share.
Alpha Group International produce consistent free cash flow, averaging over £37m annually for the past five years. Net income has grown by over 70% a year on average across the same period, which is phenomenal. If I factor in an assumed risk-free rate of 4% (3.9% is currently available on 10 year Gilts) and an assumption that net income can grow at the same pace for the next five years, dropping to 3% in perpetuity after that, I arrive at an intrinsic per-share value of £1,882. This equates to a 32% annual return.
This is actually lower than their return rate of 37.18% since listing in 2017. Now, a calculation incorporating a 70%+ growth rate makes me uneasy. When figures like this arise, I like to play it safe and halve it. If I drop the growth rate to 35%, I arrive at a per-share intrinsic value of £454.74, or 15.69% annually. That is much more comfortable, and still presents a compelling case for investment, in my view.
Deckers Outdoor Corporation (NYSE:DECK)

| Market Cap: $23.59B | P/E: 31.05 | Revenue 5Y CAGR: 16.74% |
| Net Margin: 18.29% | ROCE 5Yr Avg: 35.06% | ROE 5Yr Avg: 32.52% |
| Net Income 5Y CAGR: 24.13% | Debt / Equity: 0.13 | Dividend Yield: N/A |
The Company
Deckers Outdoor are a much simpler proposition. They design, make and sell footwear under the business name of Deckers Brands and have been in business for over fifty years. Their portfolio includes the brands Teva, Ahnu, Hoka, Koolaburra, and (the only one I’ve actually heard of), UGG. Since the mid-eighties these brands have fallen under Deckers ownership through a series of acquisitions, the last being Koolaburra in 2015.
This portfolio is positioned in two key areas, Fashion Lifestyle (UGG & Koolaburra) and Performance Lifestyle (Hoka, Teva, Ahnu). Approximately 62% of sales come from wholesale, with the remaining 38% coming from D2C. This ratio is mirrored almost exactly in it’s distribution of sales domestically (62% US) and internationally (38%). The Hoka brand is the big player in the portfolio, accounting for 66% of all sales.
With a footwear apparel company such as Deckers, management of inventory can be a telling sign of its operational efficiency. Inventory turnover rates and days inventory outstanding have stayed within a very narrow range for years, indicating a demonstrated ability to effectively manage stock levels. These figures in most cases compare favourably (or at worst, average) to comparable brands such as Nike, Sketchers and Crocs. In almost all cases, however, Deckers is growing faster, with better operating margins. (Crocs, at first glance, have some compelling metrics in that regard also. Perhaps another to investigate).
Valuation
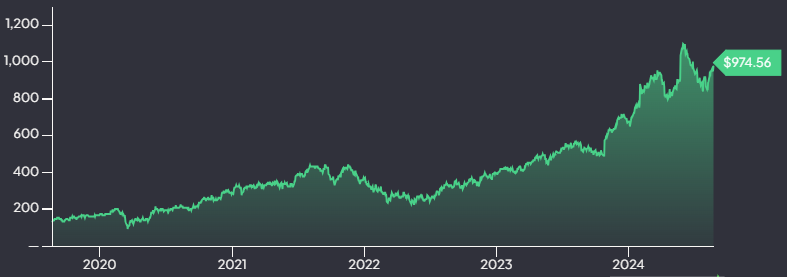
Current price: $974.56 per share.
Deckers are another cash generating machine, averaging over $450m annually for the past five years. This cash is reinvested at very attractive rates of return, and the company have grown net income by nearly 29% a year for the past five years. Assuming the same risk-free rate of 4% and an ability to grow income at the same rate for the next five years, I arrive at an intrinsic per-share value of $7,138, or a 9.31% annual price appreciation. I think this a reasonable set of data to use in calculating an intrinsic value, and whilst 9.31% annually is by no means stratospheric, for a footwear company it may be entirely acceptable.
Comer Industries S.p.A. (BIT:COM)

| Market Cap: €937.04M | P/E: 12.08 | Revenue 5Y CAGR: 26.44% |
| Net Margin: 7.19% | ROCE 5Yr Avg: 16.01% | ROE 5Yr Avg: 19.19% |
| Net Income 5Y CAGR: 43.01% | Debt / Equity: 0.36 | Dividend Yield: 3.7% |
The Company
Comer Industries is an Italian engineering and manufacturing company specialising in the production of equipment to support the industrial and agriculture sectors. Their portfolio includes mechanistic equipment such as drive shafts, axles, gearboxes and clutches for use in vehicles like combine harvesters, tractors, road construction and mining vehicles.
Comer is a family founded and (still) family run business that, too, has been around in some form for over fifty years. The business operates subsidiaries in other large markets globally, including the UK, United States and Germany, and has a manufacturing and distribution presence in India, Brazil and China. Aside from Comer Industries itself, the company own brands including Walterscheid, Mechanics® Drive Shafts and electric-only E-Comer, the ‘green’ element of the Comer business portfolio.
Valuation
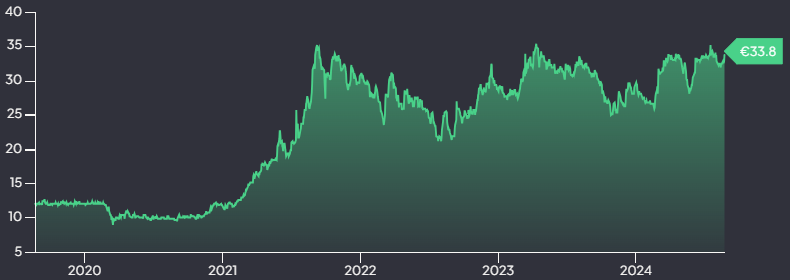
Current price: €33.80 per share.
You’ll notice a bit of a pattern here, but Comer too generate solid free cash flows annually, with a significant rise in the most recent reporting period. Net income has grown by 50% annually in the past five years, and although rates of return on invested capital are lower, the company continues to grow well. Assuming the usual variables, I arrive at an intrinsic value of €2,243 per share, or a 33.13% annual return.
Again, a continuing 50% growth rate sits a little uncomfortably for me so I’ll err on the side of caution and halve it. Doing so results in an intrinsic value of €755, or an annual return of 19.13%. Acting a little more conservatively in this way, for me, builds in some degree of a margin of safety.
CONCLUSION
The three companies discussed above are presented without recommendation or advice. This is my interpretation of the merits of each, and my opinion on the potential for them to grow and generate an acceptable return in a portfolio. That being said, I’d love to know your thoughts so please comment below, or find me on X at x.com/BritishInvestor. Do you use a stock screener? What do you screen for?
Thanks for reading! If you enjoyed this write-up, I’d be delighted if you shared it to your platform of choice.
Chriss


Great write ups I’m already invested (quite heavily) in Alpha Group, I met Morgan Tillbrook at an AGM and came away very impressed.
I will look into the others though.
Thank you for writing this up.
You’re most welcome, Simon.
Encouraging to hear your feedback about Alpha Group. Definitely one to look into further.