
Adopting the DCF
I cut my investing teeth on the writings and investment philosophies of value investing legends & authors like Warren Buffett, John Burr Williams, David Dreman and of course, Benjamin Graham. My favourite investing book is Contrarian Investment Strategies*, first published by Dreman in 1980. Whilst markets, industries and information availability have changed significantly in the decades since some of these luminaries were active, the fundamental principles of investing with a margin of safety, searching for value, and picking stocks with tangible financial performance have not. It is this solid grounding that led me to the adoption of the discounted cash flow (DCF) methodology, and I haven’t looked back since.
The Discounted Cash Flow (DCF) Analysis
A discounted cash flow analysis is a tool, nothing more. There are obviously no guarantees of performance/return, the outputs are only as good as the inputs, and in isolation should not be used solely for investment decisions. There are varying degrees of complexity in establishing the variables that you use on a DCF, however I like to keep mine as simple as possible. The fundamental premise of the way I do it is thus: I take the cash generating abilities of a business, make my best estimation of the continued ability of that business to grow at a specified rate and duration, and discount each year’s future cash flows by a rate I determine I could receive with certainty had I invested it elsewhere (which we call the risk-free rate). Because of the increased risk of return in equity investing, I add an equity risk premium to this risk-free rate to create the discount rate. I add up all the future years’ discounted free cash generation and divide the total by the shares outstanding to arrive at an intrinsic per-share value.
Simple, but not easy. What I like about it, however, is it helps keep me safe from excessive speculation. What I mean is, by the very virtue of the fact that my method can only be used on businesses that generate positive cash flow, means I steer well clear of businesses that burn through money with little to show for it, startups who may or may not ever make a profit, or companies that require such significant investment just to keep their head above water that there remains the distinct possibility that they will eventually fail, or at least run into significant difficulty.
An Example – Associated British Foods (LSE:ABF)
Let’s look at an example using a solid, if not spectacular British FTSE 100 constituent, Associated British Foods PLC.
ABF trades at around 16 times earnings, generates reasonable returns on equity at reasonable margins, and has grown net income at around 5.5% for the past decade. It also generates free cash, year after year. We firstly need to define our inputs, which generally require three things. One, a determination of free cash flows. For this I take the most recent five year average, which is £802.6m a year. This helps account for any significant fluctuations, but the most recent year’s free cash flow figure can work too. Next, we look at expected growth rates and duration. I previously mentioned that net income has grown at 5.5% for a decade, so we’ll use that for the subsequent decade as our growth rate. As standard I use a terminal growth rate of 3% after these ten years, which is a proxy for the average rate of inflation, and therefore a businesses assumed ability to increase pricing to match.
Finally we need a discount rate. That is, what could we earn with almost certainty in the next ten years (the risk-free rate mentioned earlier) PLUS our equity risk premium. For this I like to use the 10 year UK Gilt yield, which currently stands at 3.99%. For the equity risk premium I use the long-term average annual return of the respective index, in this case the FTSE 100, which stands at around 7%. Therefore our discount rate will be 10.99%. We’ll round up to 11%.
The discount rate is the expected, or desired return we want from an investment in the business. Because £100 today is worth more than £100 in one, two or ten years time (due to optionality, inflation, etc), we therefore discount each future year’s cash flows by our 11% rate to reflect this. The formula looks like this:
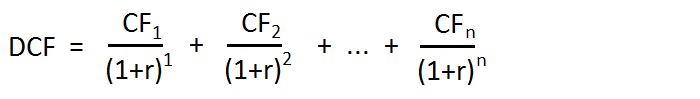
If we add up all those future discounted cash flows, dividing by the shares outstanding, we are looking for an intrinsic value above that of the current share price.
So what of Associated British Foods? Putting all those variables into my calculator, I arrive at an intrinsic value of £16.29, compared to the current share price of £22.03 today. This implies that currently, Associated British Foods is potentially overvalued, and would not represent an enticing place to put my money.
Advantages
As mentioned before, by going through the DCF process as a starting point (having screened for certain criteria beforehand) I immediately discount the more speculative investments that rely more on hope than intrinsic analysis. In my view this is a highly underrated step in an assessment process. Secondly, a DCF analysis makes no judgment of perceived “value” based on classic metrics. I.e. a P/E of 5 is treated the same as a P/E of 50, insofar as a companies ability to grow and generate cash. To take a household name, Amazon has rarely, if ever traded at a low P/E multiple, but has consistently generated cash, and has created insane returns for long-time holders.
The process also accounts for variances in the wider economic environment without the need for macro-economic forecasting through the variable representing the risk-free rate. In times of ultra low interest rates, the risk-free rate will be lower, therefore the overall discount rate will be lower, to match. For example, on September 1st 2020, the 10 year Gilt yield was 0.202%. If we used that, alongside our equity risk premium of 7%, we get a discount rate of 7.202%. Were this the case today, the intrinsic value of ABF would be £29.62, a figure higher than today’s current price and offering a more compelling argument for investing. Because the risk-free rate is lower, investors look elsewhere for returns, leading to greater stock market performance (in theory), and are willing to obtain a lower return from equities due to lack of acceptable alternatives. Conversely, when interest rates are high, equities are less appealing and the requirement for adequate return is increased.
The other advantage of the DCF model is that a number of inputs remain fixed. Because of this, it is reasonable, so long as you are realistic in the other variables, to compare two companies like-for-like to assess where best to put your money. If you are using the same discount rate and the same assumptions on growth beyond your initial period, it makes comparison fairly simple.
Disadvantages
The DCF can’t predict the future. You have to make assumptions or estimates, in one way or another, to arrive at any expected or intrinsic value. It does, as the warnings on financial products say, attempt to predict future returns from past performance. If the notion of this makes you uncomfortable, using a DCF may not be for you.
Because of the variability of return, five people could do a DCF analysis on a company and return five different results, which is why one has to be assured in their risk appetite, expectations, and understanding of the company under the spotlight. As I said earlier, this is a tool, and should not be taken in isolation without conducting a further assessment of the company, its business model, and its financial results.
Finally the tool is open to abuse. Were one inclined, one could manipulate the inputs of a favoured company to achieve the desired intrinsic value figure that validates his/her/their opinion or assumption. It is essential to not use this tool to confirm any pre-existing bias. This is why I often start with a DCF to understand whether I should investigate further, or add a company to a watch list.
How to Use a DCF
There is of course a significant degree of judgment required to determine those variables you use when calculating a DCF, and that will be open to your own interpretation, or your risk appetite. Perhaps you want to use the most recent year’s free cash flow figure. Perhaps you want to use a five year average. You may feel your equity risk premium need not be 7%, but that you’d be happy with a figure of 5%. This would lower your discount rate, and the rising tide of that decision would float all equity boats. All intrinsic equity valuations would be improved because the discount on future cash flows would be lower.My advice (and it is just advice), would be to investigate further if you feel a tool such as a DCF analysis is something you feel would add to your investing repertoire. There are models out there that are more complex than my methodology, involving terms like WACC, NPV, etc. But I try not to get in my own way, and instead keep it as simple as my average-IQ brain can handle. There are also many websites out there that will allow you to use their calculator, or in the very least assist you in building your own DCF model. I heartily recommend Lyn Alden’s page on Discounted Cash Flow Analysis, which can be found here for more examples.
What I generally look for is those rare companies that appear so mispriced, and return an intrinsic value far higher than their current price, that by design there appears a margin of safety built in. And thus my original paragraph. If I can find companies with significant perceived discounts to intrinsic value, I can afford to be slightly out in my calculations and still feel reasonably confident of a good return on my investments over time. My method is far from fully defined and I have years of refinement to go, but as a measure of valuing quality businesses I find it useful to think of as a guiderail in my search.
Thanks for reading, and happy investing! If you liked this post, please consider sharing to the social media of your choice.
Chriss
*This is an affiliate link


Hi Chriss,
Good summary. I’ve used a similar approach (discounted dividend models) for about five years and I do think these models (cash flow or dividend-based) are useful, especially in terms of coming up with a stable valuation versus the usual price-earnings ratio approach, which can be affected by the ups and downs of last year’s earnings.
This type of thinking is also used by a couple of my favourite fund managers, Nick Train and also Ian Lance & Nick Purves, both of whom use models that forecast earnings growth out to some future “normal” year within the medium-term (5-8 years), and then come up with a valuation based on a historically normal multiple of those “normal” future earnings.
It’s different to DCF and DDM models, but in the same ballpark.
Good luck with your return to blogging,
John
Thanks John, appreciate you taking the time to reply and for your kind words.
It’ll be an ongoing process learning how best to construct the DCF, but I think holding on to the principles and purpose of the valuation model is the most important thing.